The attractive illusion of cheap markets
Markets had a difficult start to the year. Returns are broadly negative across major regions, with the S&P 500 down 4.3%, the NASDAQ off 5.8%, and the Euro Stoxx lower by 3.6%. The ASX 200 has held up well, in comparison, declining only 1.6%, supported by its higher concentration of energy stocks. There has been little place to hide. A stronger US dollar and rising bond yields, driven by persistent inflation concerns, have tightened financial conditions globally and weighed on both equities and risk assets across the board.
Nevertheless, markets rebounded sharply in recent weeks, pushing back toward record highs. At the same time, a narrative has emerged that equities, particularly in US technology, are becoming "cheap" again. This view rests largely on price-to-earnings ratios, which have fallen from recent extremes.
Valuations have improved on paper. But not for the right reasons.
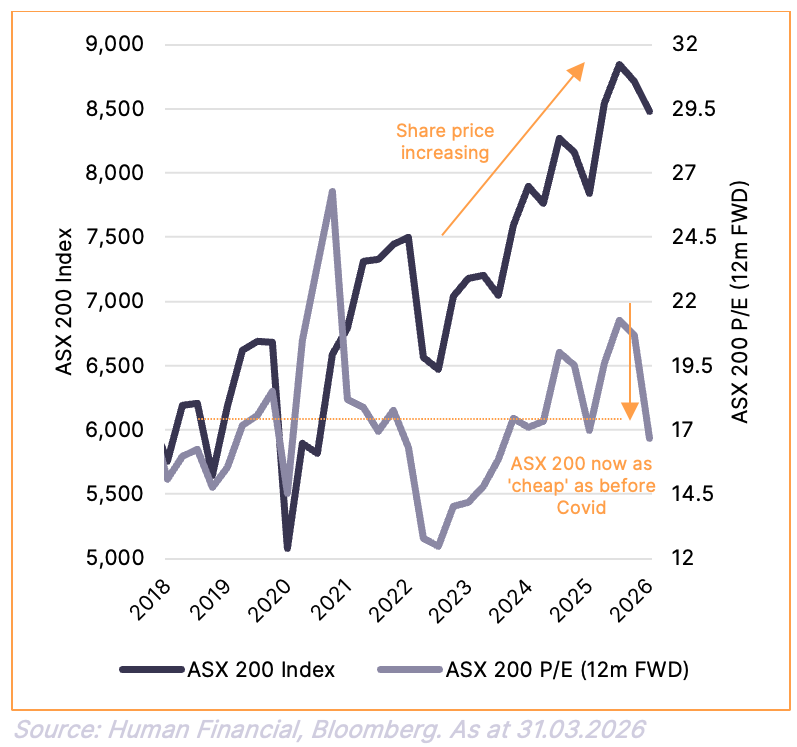
Figure 1 below tells the real story. The S&P 500 peaked at around 6,845 before pulling back to 6,529 by month end. Its 12-month forward price-to-earnings (P/E) ratio peaked at 25.6x and has since compressed to 20.2x. The ASX 200 tells a similar story in Figure 2: the index peaked near 8,849 and closed the quarter at 8,482, with its forward P/E compressing from 21.3x back to 16.7x. However, in both cases, while valuations have moved off their highs, they remain above long-run averages, the S&P 500 long-run average sits around 17.7x, and the ASX 200 is only marginally above its own.
Crucially, this apparent improvement has largely been driven by rising earnings expectations rather than by prices falling to more attractive levels. Consensus forecasts now imply earnings growth of around 20% over the next 12 months. It is this upward revision to the denominator that has mechanically lowered P/E ratios and created the impression of better value. The price has barely moved. The assumption has done the work.
Figure 1. S&P 500 Valuation
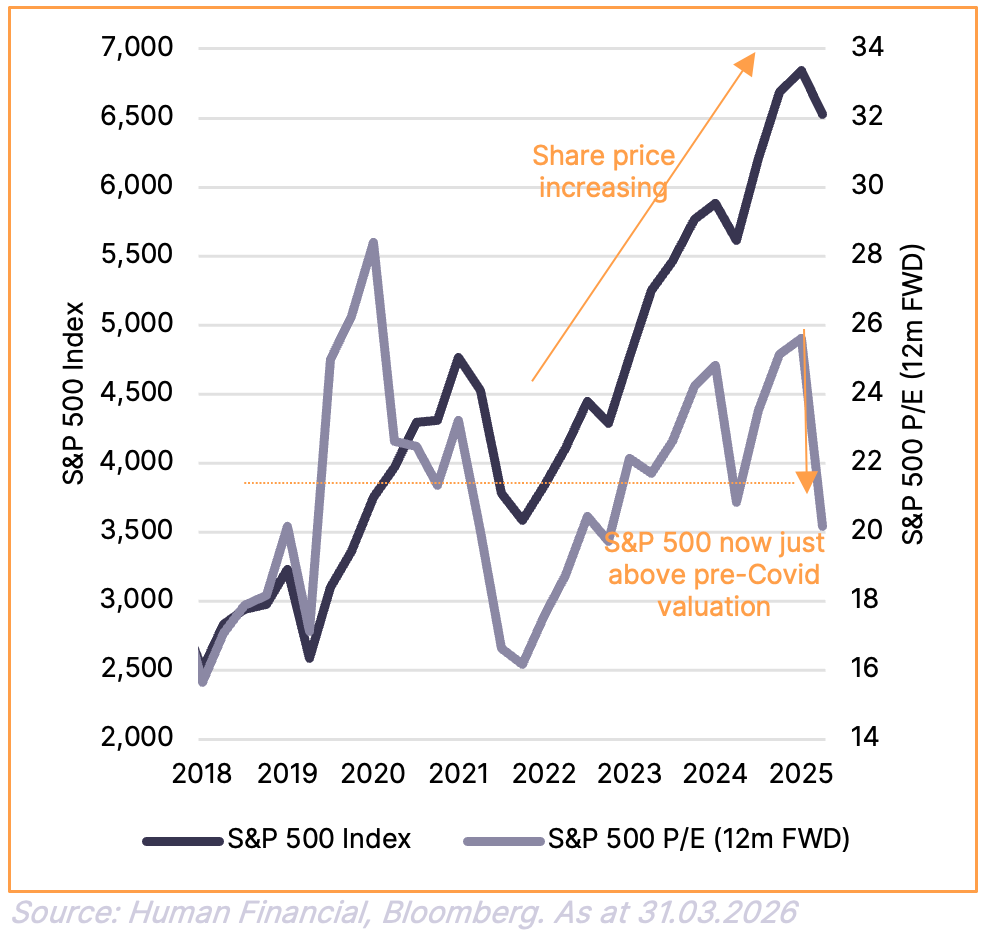
Figure 2. ASX 200 Valuation
The historical record puts this in sharp relief.
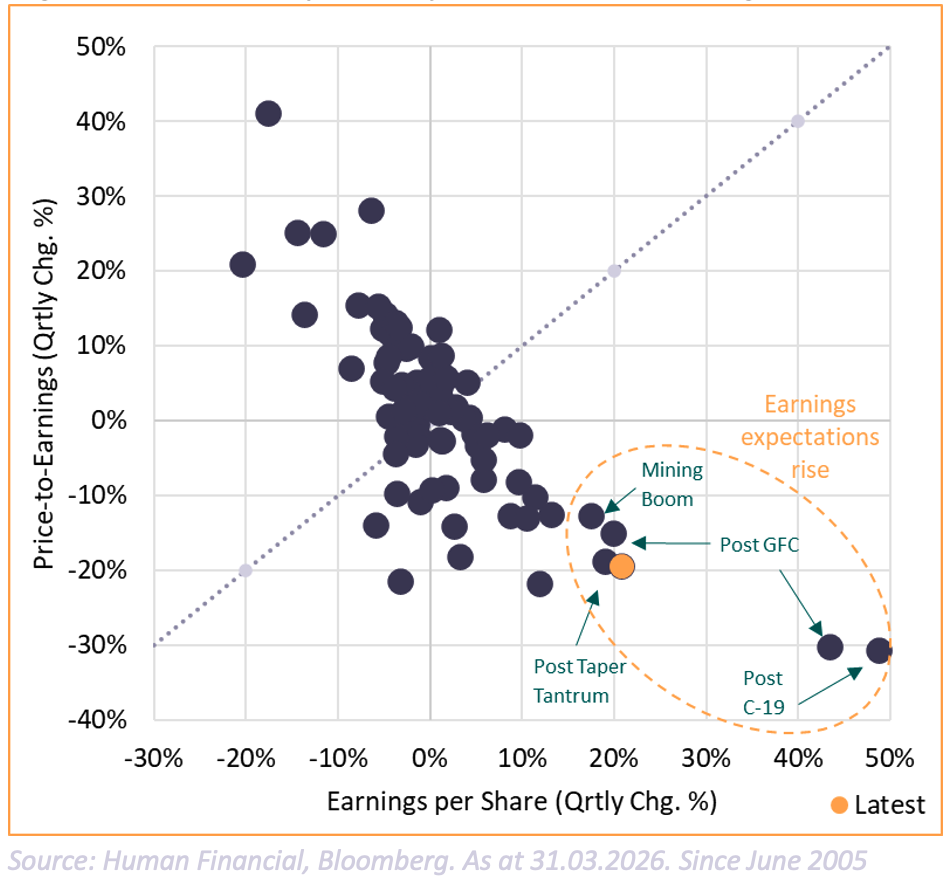
Figure 3 and Figure 4 below plot every quarter of history for both the S&P 500 and the ASX 200, mapping the quarterly change in forward earnings per share (EPS) against the quarterly change in the price-to-earnings multiple. The latest reading (shown in orange) sits in the lower-right zone of each chart: EPS expectations rising around 20% in the quarter while the P/E has compressed by a similar amount.
At first glance, that combination might appear encouraging. Earnings going up, valuations coming down, isn't that exactly what investors want to see?
The chart reveals why the context matters enormously. The only other times EPS upgrades of this magnitude have occurred were the recoveries that followed dramatic market selloffs. Post Tech Bubble. Post GFC. Post the 2018 volatility shock. Post COVID. Each of those data points sits in the same zone as today's reading, and in every case, the surge in earnings expectations came after prices had already fallen sharply to reflect genuine economic distress. The upgrades were a recovery from a low base, not a forward projection from elevated prices.
The Australian data adds one further exception: the mining boom. That period produced genuinely supernormal profits, driven by an extraordinary China-led commodity cycle that compressed a decade of resource investment returns into a few short years. It was, by definition, a structural one-off.
Today shares none of these characteristics. There has been no comparable selloff. Prices have not reset to reflect distress. The current EPS upgrades are not a recovery, they are a forecast, embedded in current market pricing, that assumes a step-change in corporate profitability with no historical precedent outside of crisis recoveries or once-in-a-generation commodity cycles.
Figure 3. S&P 500 quarterly EPS and P/E Changes
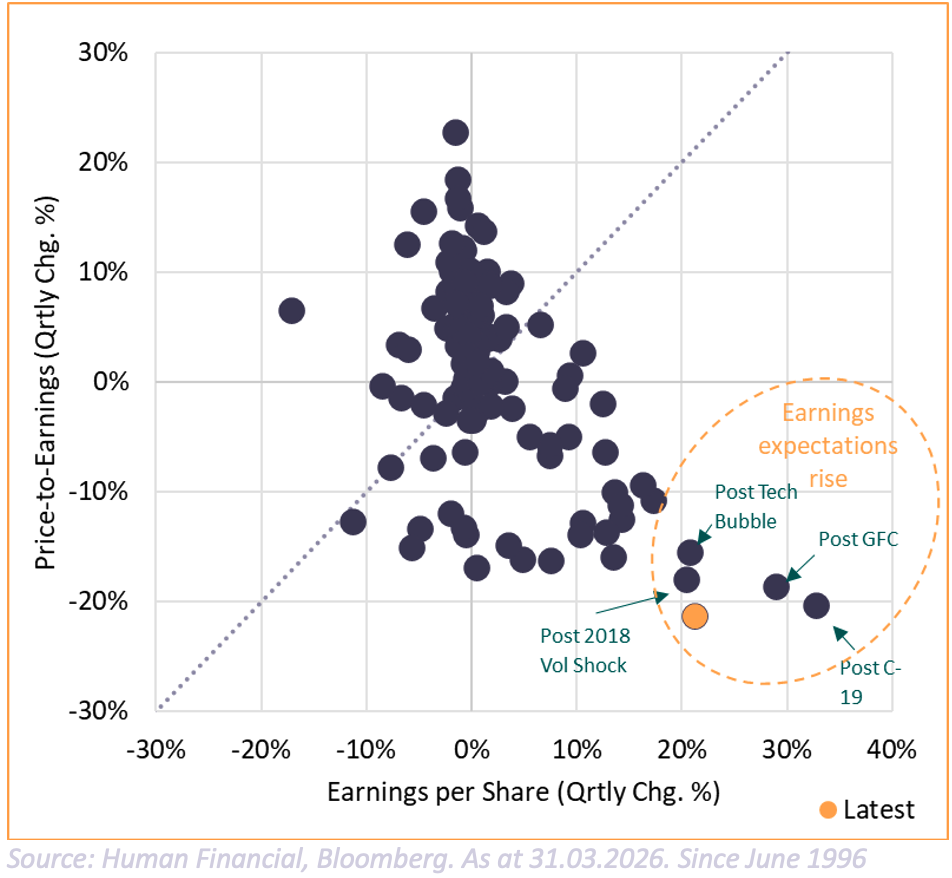
Figure 4. ASX 200 quarterly EPS and P/E Changes
The tech bubble parallel is instructive, and uncomfortable.
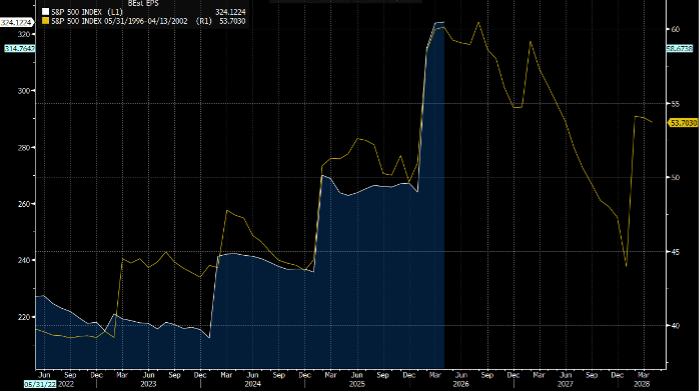
The chart below overlays the trajectory of S&P 500 forward earnings estimates today against the equivalent path from 1996 through to the collapse of the tech bubble in 2002. The resemblance is striking. Both periods show a long, gradual build in consensus earnings expectations, followed by a sharp acceleration and then a peak. In the historical analogue, that peak marked the beginning of a dramatic downward revision as the gap between expectation and reality closed sharply. Current forward EPS of around $324 sits right at what looks like an equivalent inflection point.
This is not a prediction. But it is a pattern worth taking seriously. The lesson from that period, and from every comparable episode, is that investors consistently struggle to identify turning points in earnings cycles until after the fact. Consensus forecasts are rarely pessimistic at market peaks. They are typically at their most optimistic, which is precisely what makes the eventual correction so abrupt. Analysts extrapolate recent trends; they do not model discontinuities in advance.
Figure 5. S&P 500 EPS – then and now
Source: Human Financial, Bloomberg. As at 31.03.2026
Our conclusion
Our view remains unchanged: it is too early to call this market cheap, and too early to add risk.
The conditions for earnings disappointment are in place. Financial conditions have tightened. Macro uncertainty remains elevated. Trade and geopolitical pressures are bearing on corporate margins. And the cushion against disappointment, in the form of lower starting valuations, is not yet there.
We are not forecasting a crash. However, we do observe that markets are pricing in an outcome that requires near-perfect execution from the corporate sector against a backdrop that offers limited margin for error. When that gap between expectation and reality has existed before, it has generally closed in one direction.
We would rather be patient and wait for either lower prices or more credible earnings support before adding exposure. In the meantime, we continue to favour portfolios that are positioned for resilience rather than reaching for return.
Data as at 31 March 2026. This commentary is general in nature and does not constitute financial advice.
More like this