
Extra hot or extra strong?
In the last couple of months of 2023, global economic data surprises^ had been falling into neutral (zero) territory suggesting expectations were no longer being exceeded. Outside of Australia, that trend reversed in January with the US data surprises reaccelerating, while the same measures in Australia and broader emerging markets fell.
Figure 1. Economic Surprises have rose in January in US while falling in Australia and Emerging Markets

Source: Citi Economic Surprise indices, Bloomberg
On top of US data currently beating expectations, the latest Atlanta Federal Reserve GDPNow forecast is predicting Q1 GDP of 4.2%* (as at 01/02/24). This continued expectation of strong future growth could explain the record high levels in equity markets. But could it be that the US is not strong, but is running too hot?
The chart below compares quarterly US GDP numbers from 1960-2019 (to avoid COVID anomalies) with the subsequent GDP change 1 year later. The general trend is quite clear – the stronger/weaker the starting point the weaker/stronger the GDP growth is 1 year later. The chart also highlights that from today’s level of expected growth there has only been one instance where growth rose 12 months later in the 1970s (pink dot) a period of high inflation, multiple recessions, and poor market performance.
What’s the difference between ‘strong’ and ‘hot’? The answer to this is more art than science, however history suggests that following periods of 5% (or more) growth the economy stalls with an 80% probability of GDP being lower in the subsequent 12 months and a 25% probability it will be negative. Remember the old market adage – stairs up and elevator down! Add to that the fact that equity markets are at (or near) all time highs, and we see the risks as substantially skewed to the downside.
Figure 2. US Quarterly GDP 1960-2019 (Pre-COVID) – the higher the starting point the lower the next year’s growth
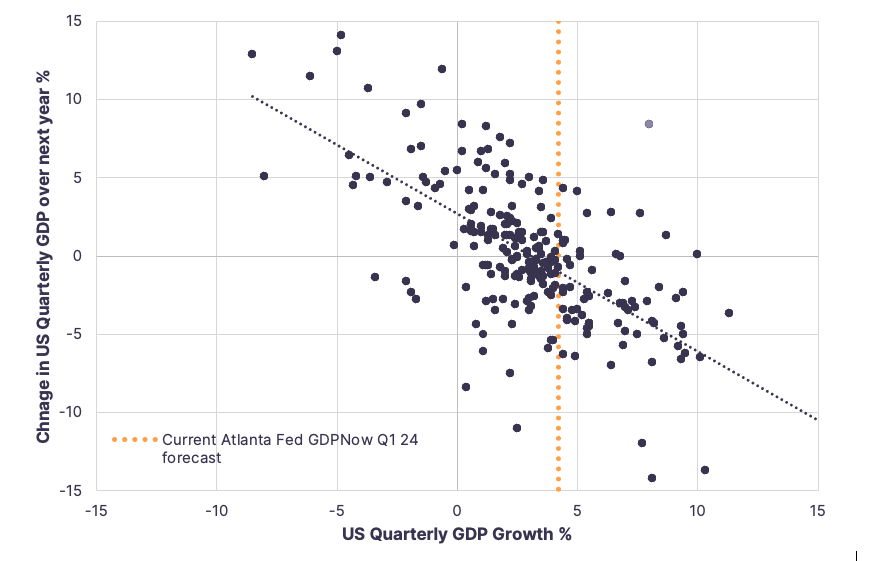
Source: Bloomberg, CFML. Note: axis have been shortened for formatting i.e. some outlying quarters might not be showing in chart
Market Performance
Equities
Major developed market equities finished up for the month, led by Japan’s Nikkei index – S&P 500 +1.7%, Nasdaq +1.9%, Euro Stoxx +2.9% Nikkei +8.4% ASX 200 +1.2%. While broad emerging markets were positive +0.9%, China related stocks were lower – Hang Seng -9.2% and CSI 300 -6.3%. On a sector basis in Australia, energy stocks performed strongest +5.2%, followed by financials +4.9% while utilities -1.5% and materials -5.0% suffered losses during January.
Government Bonds
In fixed income markets, government bond yields rose in most major markets apart from China where ongoing stimulus pushed yields lower. The benchmark 10-year maturity bond yields in the US (3.91%) and Australia (4.01%) were marginally higher over the month by 0.03% and 0.06% respectively.
Currency
As is often the case in January, markets can reverse the trend of the previous year, this was most evident in currency markets with a +2% rally in USD. This rally was driven by the stronger US data with investors now having to digest the likelihood that the US Federal Reserve will not be able to cut interest rates as quickly as expected. The Australian dollar was one of the worst impacted currencies falling -3.9% wiping out all of December’s gains.
A frosty outlook
Here in Australia the end of a long, hot, humid summer is approaching, with the onset of cooler weather. In our opinion, markets may also be heading for a cool-off, and potentially a big chill.
While expectations are elevated and stock prices are high, and there is consensus around no recession this year, the reality is that higher interest rates are dampening economic activity through elevated mortgage repayments.
From an investment perspective we have two takeaways – stay defensive and be patient. Both are achieved through our continued higher allocations to attractive yielding higher quality fixed income strategies.
Since we continue to expect future frost, we’re happy to earn the income from bond payments without chasing the heatwave in equity markets.
^ Source: Bloomberg, as measured by Citi Economic Surprise Indices,https://www.atlantafed.org/cqer/research/gdpnow
* https://www.atlantafed.org/cqer/research/gdpnow, as at 01/02/24